- Published on
Beginner's Guide to Interpreting CGM Data
The Beginner's Guide to Interpreting CGM Data
Starting your journey with a Continuous Glucose Monitor (CGM) is a major step toward taking control of your metabolic health. For many, seeing a stream of real-time blood sugar data for the first time can feel overwhelming—it’s like getting the keys to a high-performance cockpit without a manual. However, once you learn how to read the signals, that data becomes your most powerful tool for making informed lifestyle choices.
Whether you are living with diabetes or simply working to optimize your metabolic health, understanding your CGM data is about spotting patterns, not obsessing over single numbers. Let’s walk through how to interpret your glucose readings and turn those data points into actionable insights.
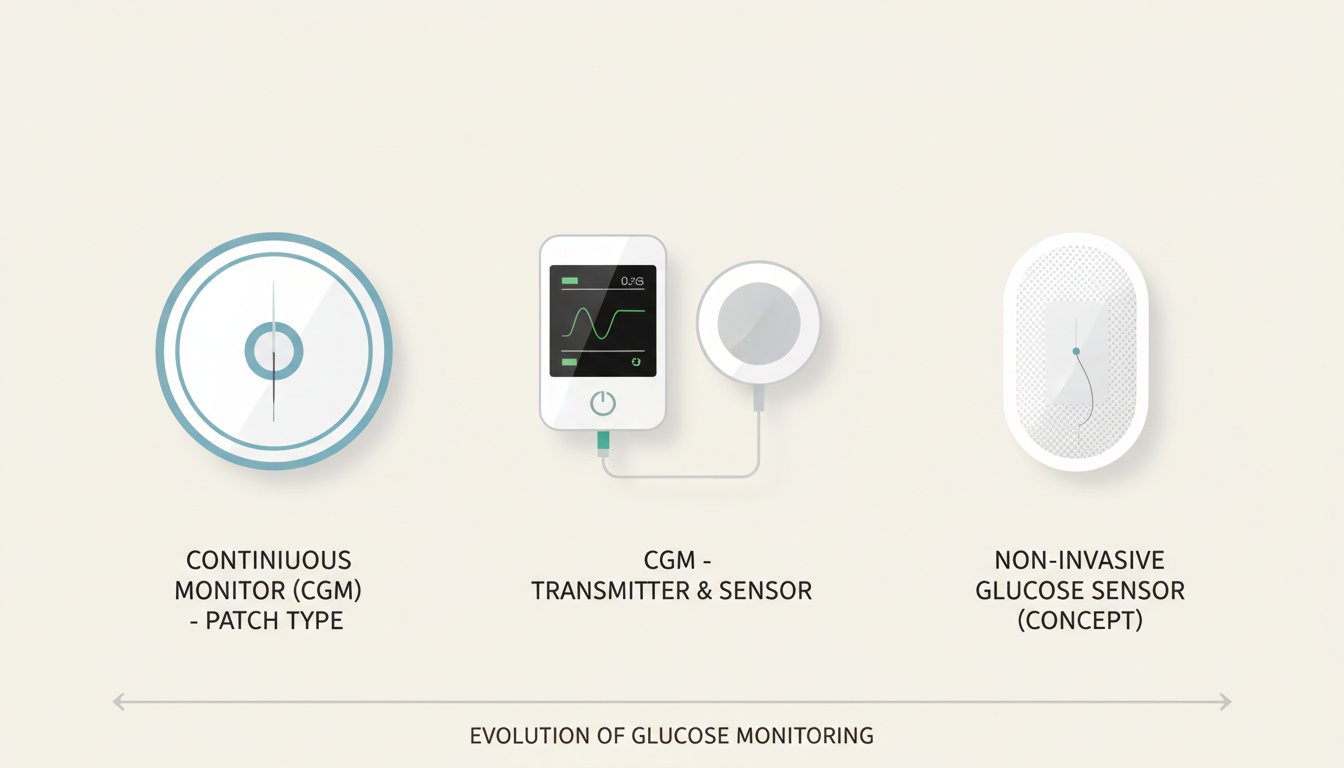
What Is a CGM and Why Does It Matter?
A CGM is a small, wearable device that measures your glucose levels continuously throughout the day and night using a tiny sensor just beneath your skin. Unlike a traditional finger-prick test, which gives you a static snapshot of your blood sugar at one specific moment, a CGM provides a complete picture of your metabolic trends.
This constant stream of data allows you to see how different foods, physical activities, stress levels, and even sleep quality affect your glucose. By observing these trends, you move from guessing how your body responds to stimuli to knowing exactly what works for your unique biology.
Understanding the Core Metrics
Before you dive deep into the charts, you need to know the language of glucose monitoring. Here are the primary metrics you will see on your dashboard:
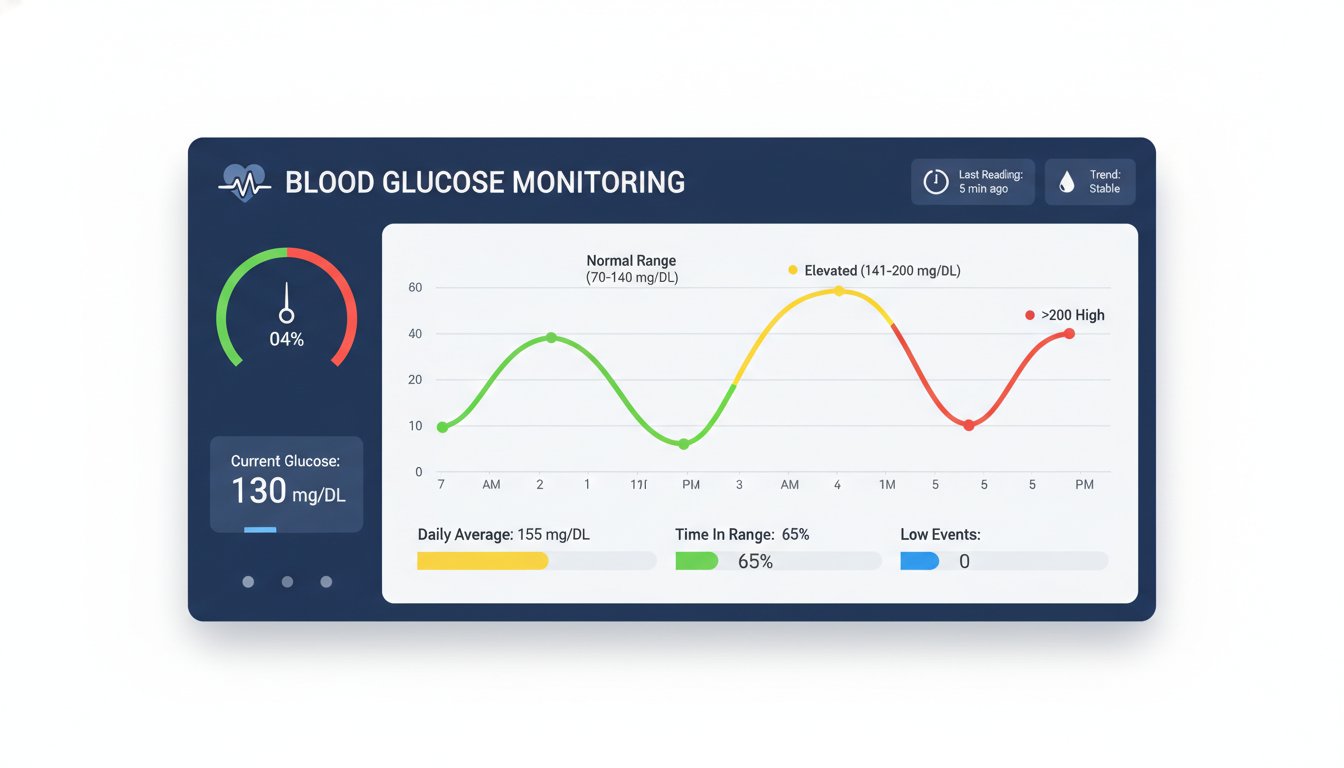
Glucose Levels (mg/dL)
This is your current blood sugar concentration. Most people aim for a target range, often between 70 and 180 mg/dL, though your personal target should be determined by your healthcare provider.
Time in Range (TIR)
This is arguably the most important metric for long-term health. TIR is the percentage of time your glucose stays within your target range over a 24-hour period. As discussed in our related article on Time in Range, consistently hitting a high TIR is often a better indicator of metabolic health than A1C (the average blood sugar level over 3 months) alone.
Glucose Variability
This refers to how much your blood sugar swings up and down. Ideally, you want a "flat" line rather than a "rollercoaster" pattern. Frequent, sharp spikes and crashes can increase oxidative stress and make you feel fatigued, even if your average glucose looks okay.
How to Interpret Your Daily Patterns
When you look at your daily graphs, try to look for the "stories" behind the lines. Here is how to analyze your data:
- Identify the Spikes: If you see a sharp rise after a meal, look at what you ate. Was it high in refined carbohydrates? Did you eat it on an empty stomach? You might find that switching the order of your food—like eating fiber and protein before carbs—helps flatten that curve, a concept we explore in our guide on food order.
- Watch the Overnight Baseline: Your fasting glucose, or the level when you wake up, tells you how well your body is managing insulin while you sleep. If your numbers are consistently high in the morning, it might be worth investigating your sleep quality or your last meal of the day, as detailed in our post on sleep and blood sugar.
- Note the Effect of Movement: If you notice your glucose dropping or stabilizing during a walk, that is your body using glucose effectively. Monitoring these moments helps you understand the right timing for physical activity to maximize insulin sensitivity.
Troubleshooting Common Interpretations
It is normal to feel confused when your data doesn't match your expectations. Here are two common hurdles:
The "Lag Time"
CGMs measure glucose in your interstitial fluid (the fluid surrounding your cells), not your blood directly. This means there is often a 5- to 15-minute delay compared to a finger-prick test. If you see a sudden spike, don't panic; look at what you did 15 minutes ago.
The "Compression Low"
If you sleep on your sensor, you might see a sudden, artificial drop in your graph. This is called a compression low and happens because the pressure restricts the fluid flow around the sensor. If you wake up and your numbers return to normal instantly, it was likely just a pressure artifact, not a real blood sugar crash.
Putting It All Together with GlucoAI
While looking at raw numbers is educational, the real magic happens when you use tools to synthesize that data. Many people find that manual logging is difficult to sustain. Using a platform like GlucoAI allows you to connect your CGM data, enabling you to see correlations between your diet, activity, and glucose levels without the need for manual spreadsheet entry.
When you use a tool that automates the tracking process, you can focus on the "why" instead of the "what." You can experiment with different meals or workout routines and see the results in real-time, helping you build sustainable habits that support your long-term health goals.
Summary: Key Takeaways for Success
Interpreting your first CGM data set is a skill that improves with practice. Keep these three points in mind:
- Focus on Trends, Not Perfection: Don't let a single spike ruin your day. Look for the overall pattern of your Time in Range and how you can improve it over time.
- Context is King: Always log your meals, exercise, and stress levels alongside your data. A number without context is just a data point; a number with a note is a health insight.
- Consult Your Team: Your CGM data is a conversation starter for your doctor. Bring your reports to your next appointment to discuss trends and adjust your management plan safely.
Remember, you are the expert on your own body. Use your CGM as a guide to listen to what it needs. Start by tracking your habits consistently for one week, and you will be amazed at how much you learn about your metabolic health. If you are looking for an easier way to correlate your lifestyle with your glucose trends, consider how GlucoAI can help you turn those complex charts into clear, actionable progress.
Disclaimer: This guide is for educational purposes only and does not constitute medical advice. Always work closely with your healthcare provider to interpret your CGM data and make decisions regarding your diabetes management or health plan. Never ignore professional medical advice because of something you read here.
GlucoAI — Smart Blood Sugar Monitor
Track, analyze, and optimize your glucose levels with AI-powered insights.